Skiaform / Guides
Site analysis in architecture: what to map and draw
What a site analysis includes, how to draw it in clear layers and one board, and how sun, access and context lead to decisions in a studio project.
A site analysis records the conditions your design responds to, drawn so a reviewer can see what you found and what you did about it. An architecture site analysis usually starts with a base plan, your research and a site visit, then turns into a set of diagrams that explain decisions. Keep what you observed separate from what you propose, so every response can be traced back to its source.
What a site analysis includes
Use this as a checklist. For each condition, note where the information came from and what you still need to check.
- Context and neighbours. Surrounding buildings and open spaces, especially the edges facing your site, with heights and uses where you can confirm them.
- Access and movement. Entrances, paths and streets, with pedestrian routes kept apart from vehicle movement. Check that routes really connect before you draw an arrow between them.
- Sun and shade. Orientation, and how the sun moves across the site. Shade you saw at a recorded time is different from shade a study predicts.
- Wind and climate. Research these for your own location, and think about how nearby buildings or landform change exposure. Label the source of any climate data.
- Views in and out. What you can see from the site and where people can see into it, each marked from the spot where you looked.
- Noise. Possible sources and when they run. A concern to check is not the same as a measured level.
- Water and landform. Levels, slopes and water edges, from surveyed information where it exists. Mark the gaps before proposing drainage or regrading.
- Vegetation. Trees and planting that could affect the design, with their positions checked on site.
- Rules that limit the site. Zoning, setbacks and heritage protections. Read the local authority's own documents and note which ones apply.
Draw it in layers
Start with a quiet base plan that shows just enough context to place each condition. Copy it for each topic, keeping the crop, orientation and scale identical, and draw one condition per copy. Only then decide which layers belong together.
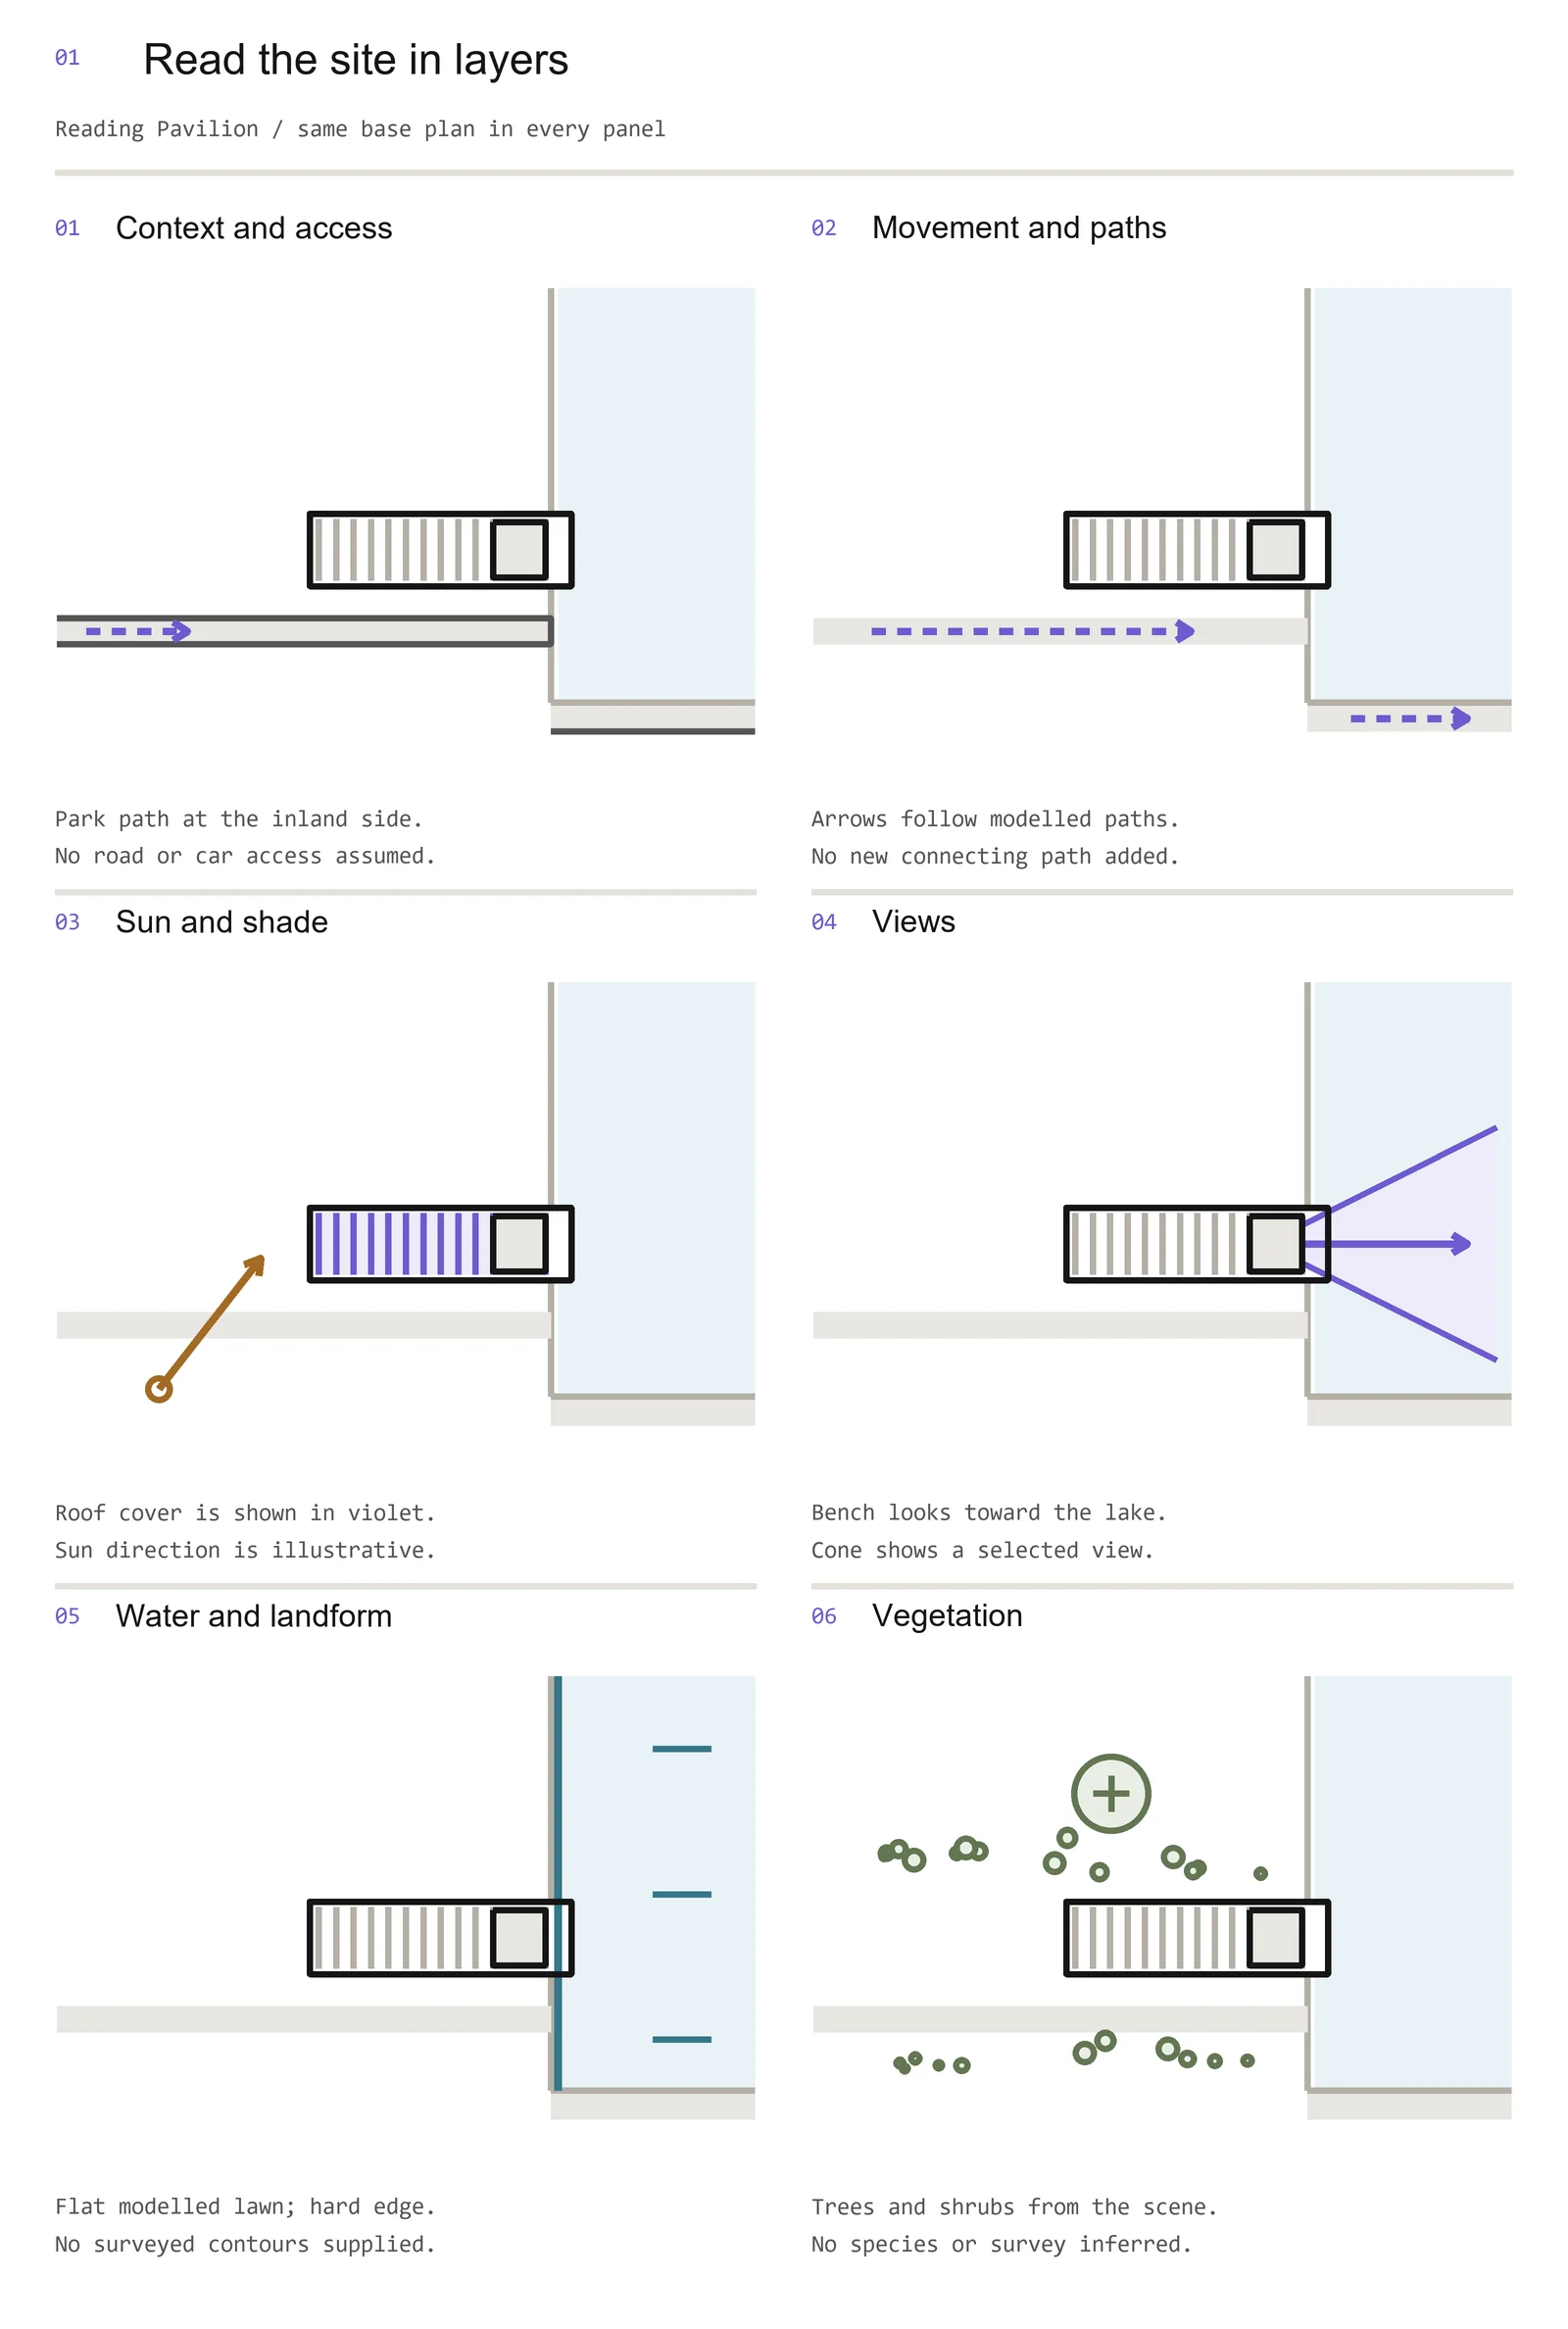
The Reading Pavilion is a fictional sample project. Its layers share one base showing the park paths, the lake edge and the planting from the model, with movement directions and a view cone toward the lake added for teaching. In the sun and shade layer, the violet fill is the roof, and the sun arrow is illustrative rather than calculated.
Keep the base lighter than the information on top of it. Give each layer a short title and a note on its source or assumption, then compare the layers for relationships your design could test.
Assemble one site analysis board
Combine layers only while they stay easy to tell apart. Keep the main drawing large, the legend close to it, and short conclusions next to the marks they explain, so the board says what each condition means for the project.
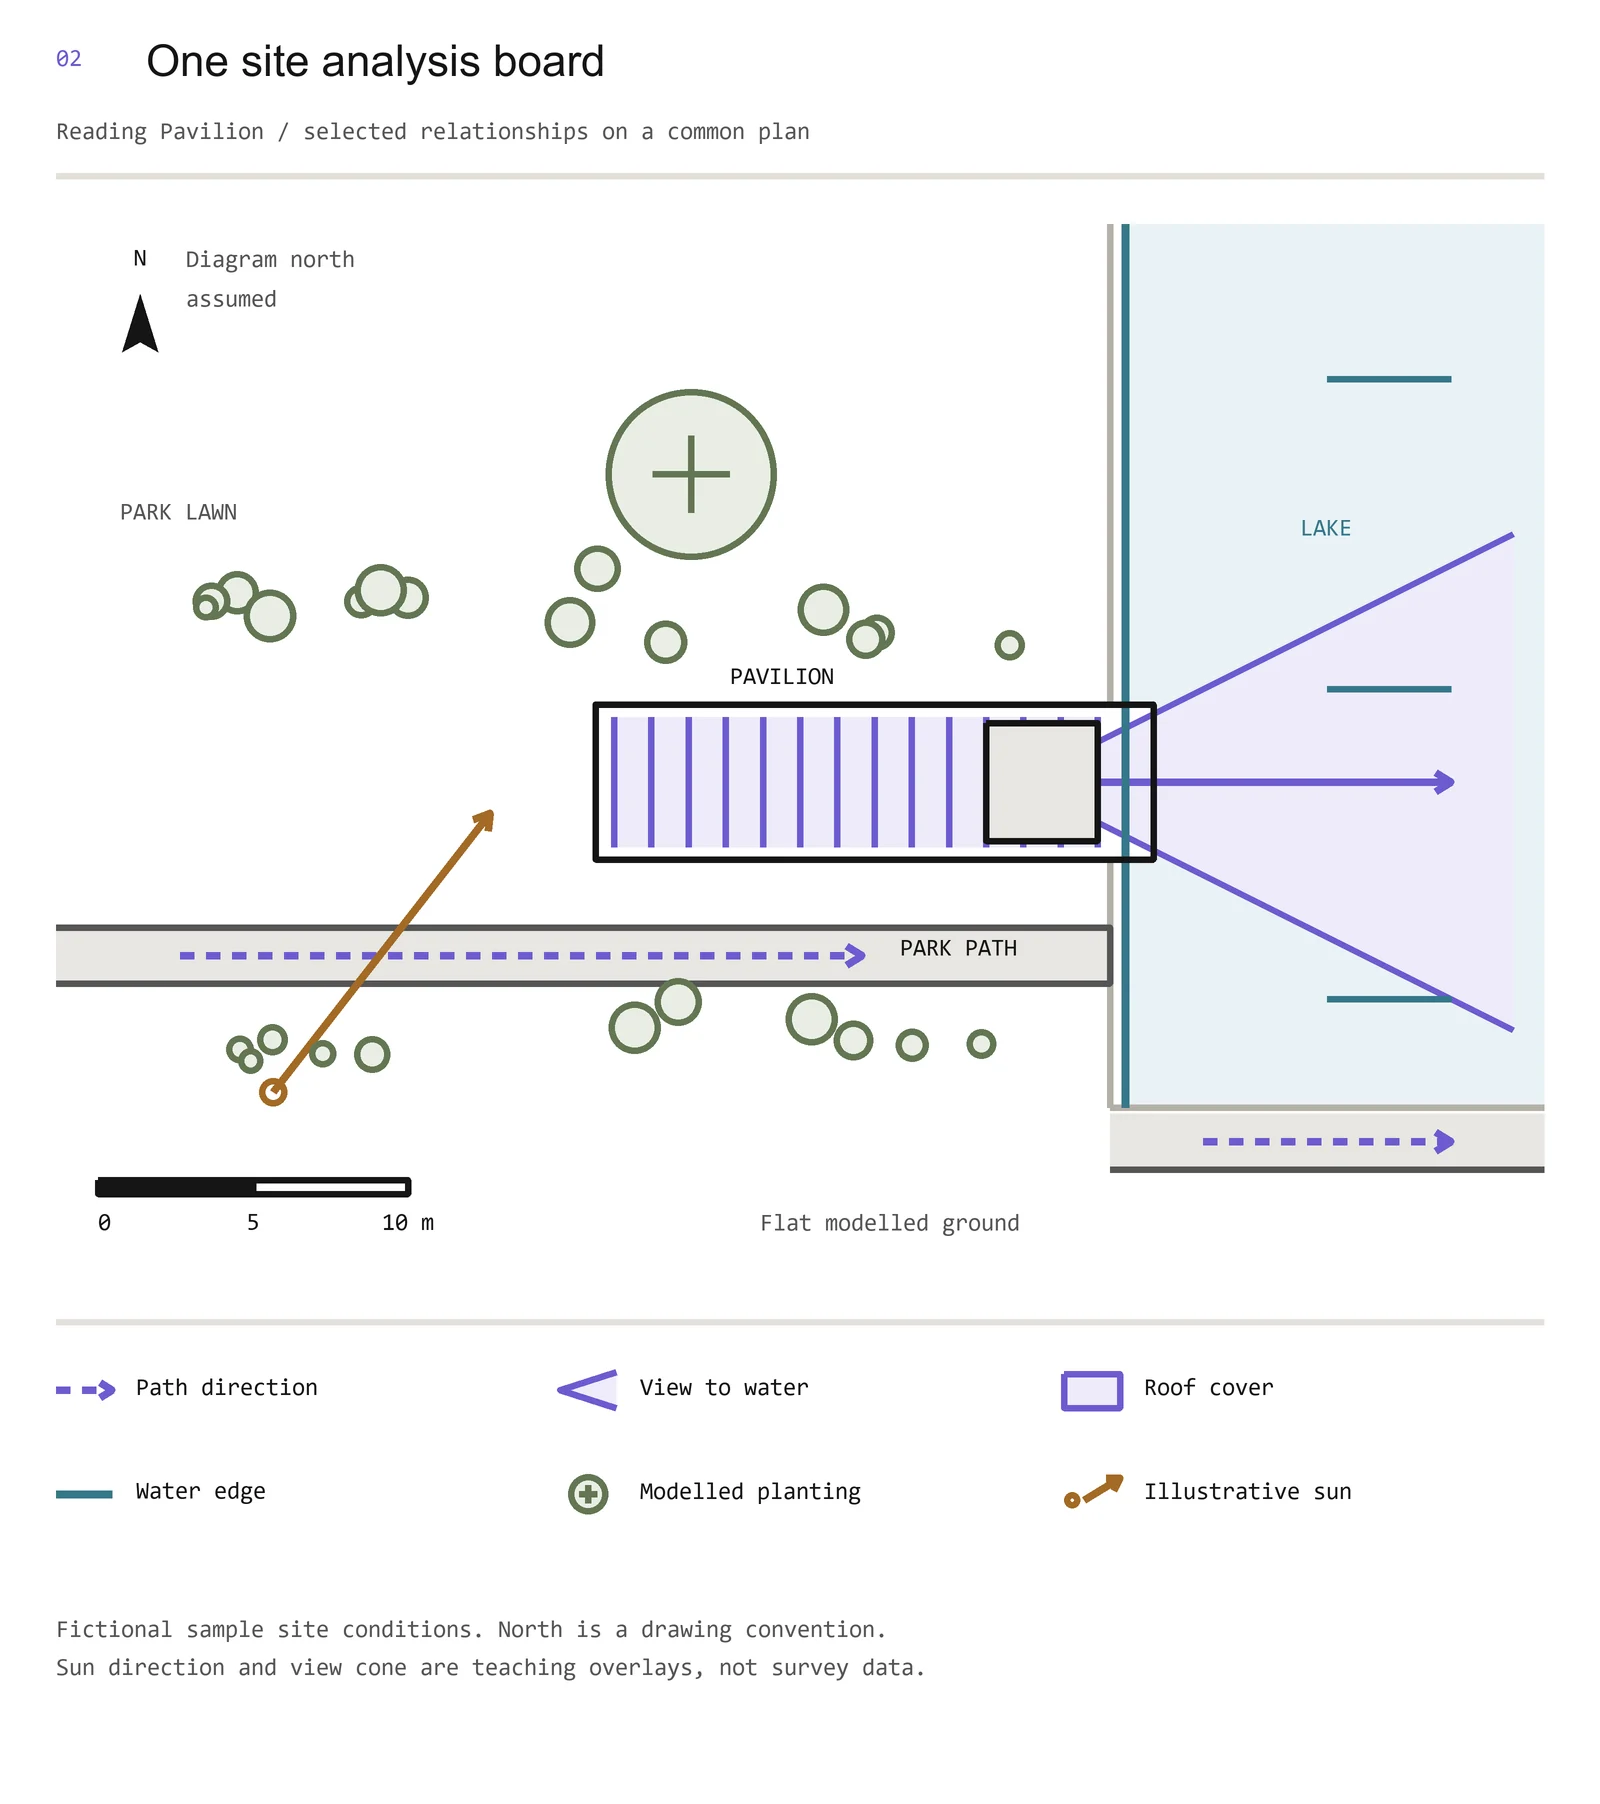
This board combines the pavilion's paths, roof, planting and lake view on one base. The bench stays visible under the view cone, so you can see where the view starts, and the route arrows follow the modelled paths.
Every site analysis board needs a north arrow, a graphic scale bar and a legend that matches the drawing. Here north is marked as assumed, because the fictional park has no real bearing. A graphic scale stays correct when the board is resized, which a written ratio does not. A good test for your own board: can someone find the source, direction and meaning of each mark without reading a long caption?
Sun path and shade
A sun path diagram shows the sun's direction and height across the sky on chosen dates. For your own site, use a sun path tool set to its latitude, and check the orientation and date settings. If you work in clock times, check how the tool handles time zones.
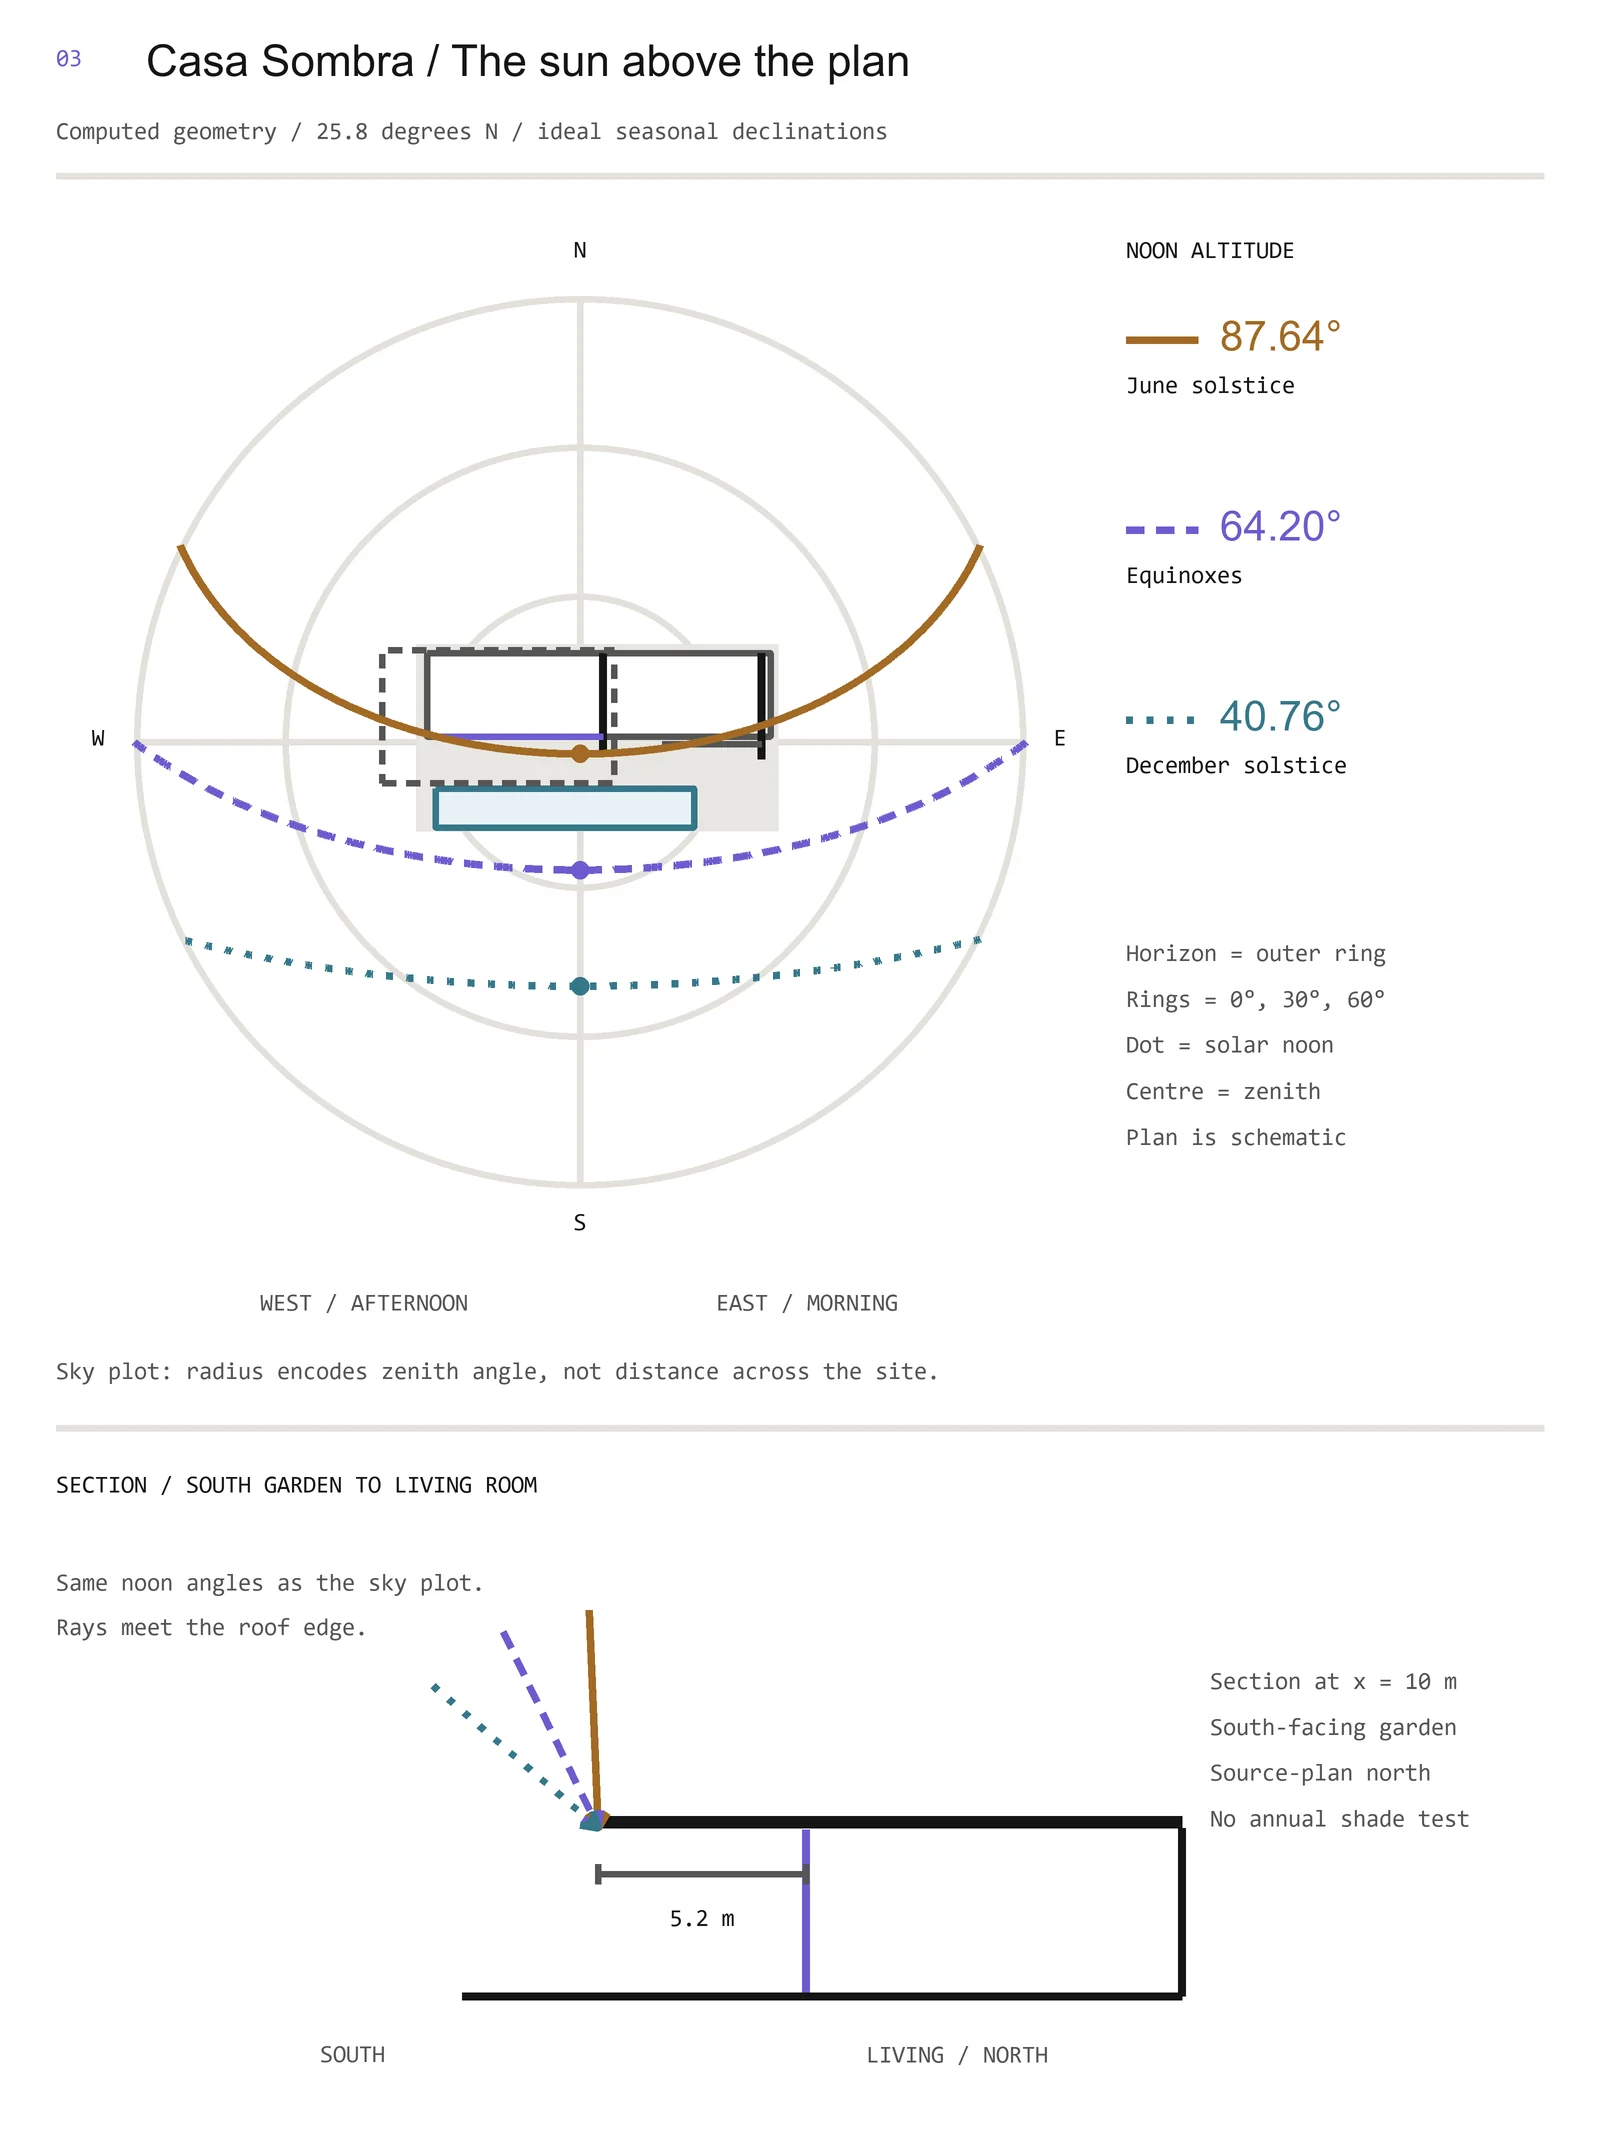
Casa Sombra, another fictional sample, is set in Miami, at about 25.8 degrees north. Its noon sun altitudes are 87.64 degrees at the June solstice, 64.20 degrees at the equinoxes and 40.76 degrees at the December solstice. These come from a standard solar formula and are ideal geometry, not a shading or comfort study.
On the sky chart, the outer circle is the horizon and the centre is directly overhead. Each point places the sun in the sky, not a shadow on the ground. The living room glass faces south, and the section sets the noon sun angles against the roof and glazing so you can compare them. To study shade on your own proposal, you also need the surrounding obstructions and the dates and times that matter for each space.
Urban sites: neighbours, frontage and noise
On an urban site, draw the neighbouring buildings and the street edge along with the plot. When building heights or the gap between facades matter, add a section. Label what you observed separately from what you are concerned about.
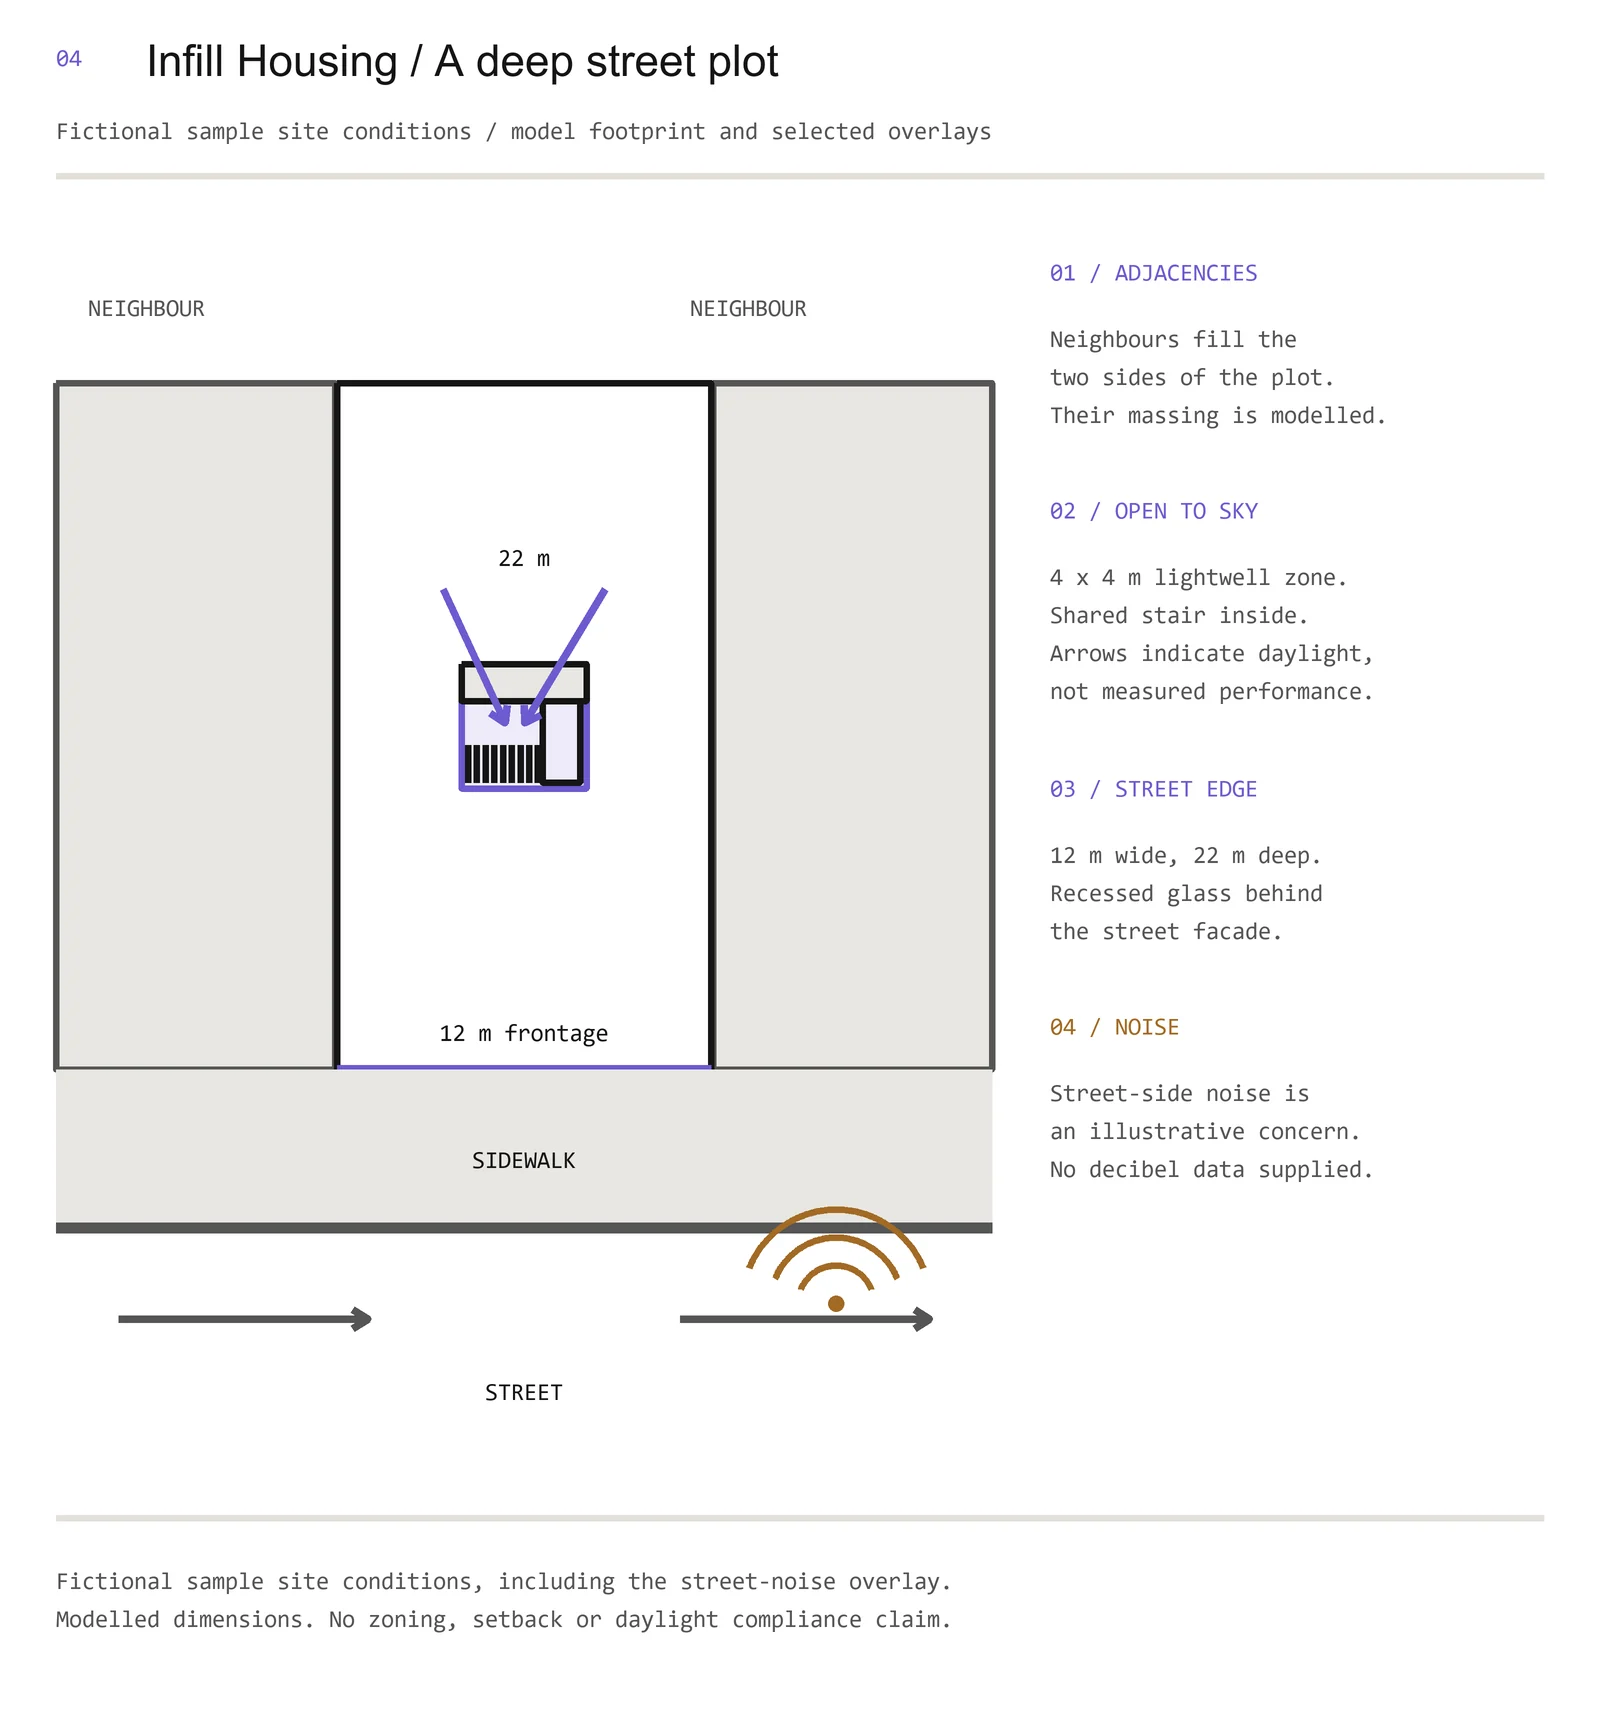
Infill Housing sits on a deep plot between two neighbours, with a 12 m frontage, a depth of 22 m, and a street and sidewalk along the front. These street conditions are part of the fictional sample. The noise symbol and traffic arrows mark things to investigate, and the daylight arrows in the central lightwell show direction only.
From analysis to design
Write each finding next to the design response you can point to in plan or section. The three pairs below come from the fictional samples.
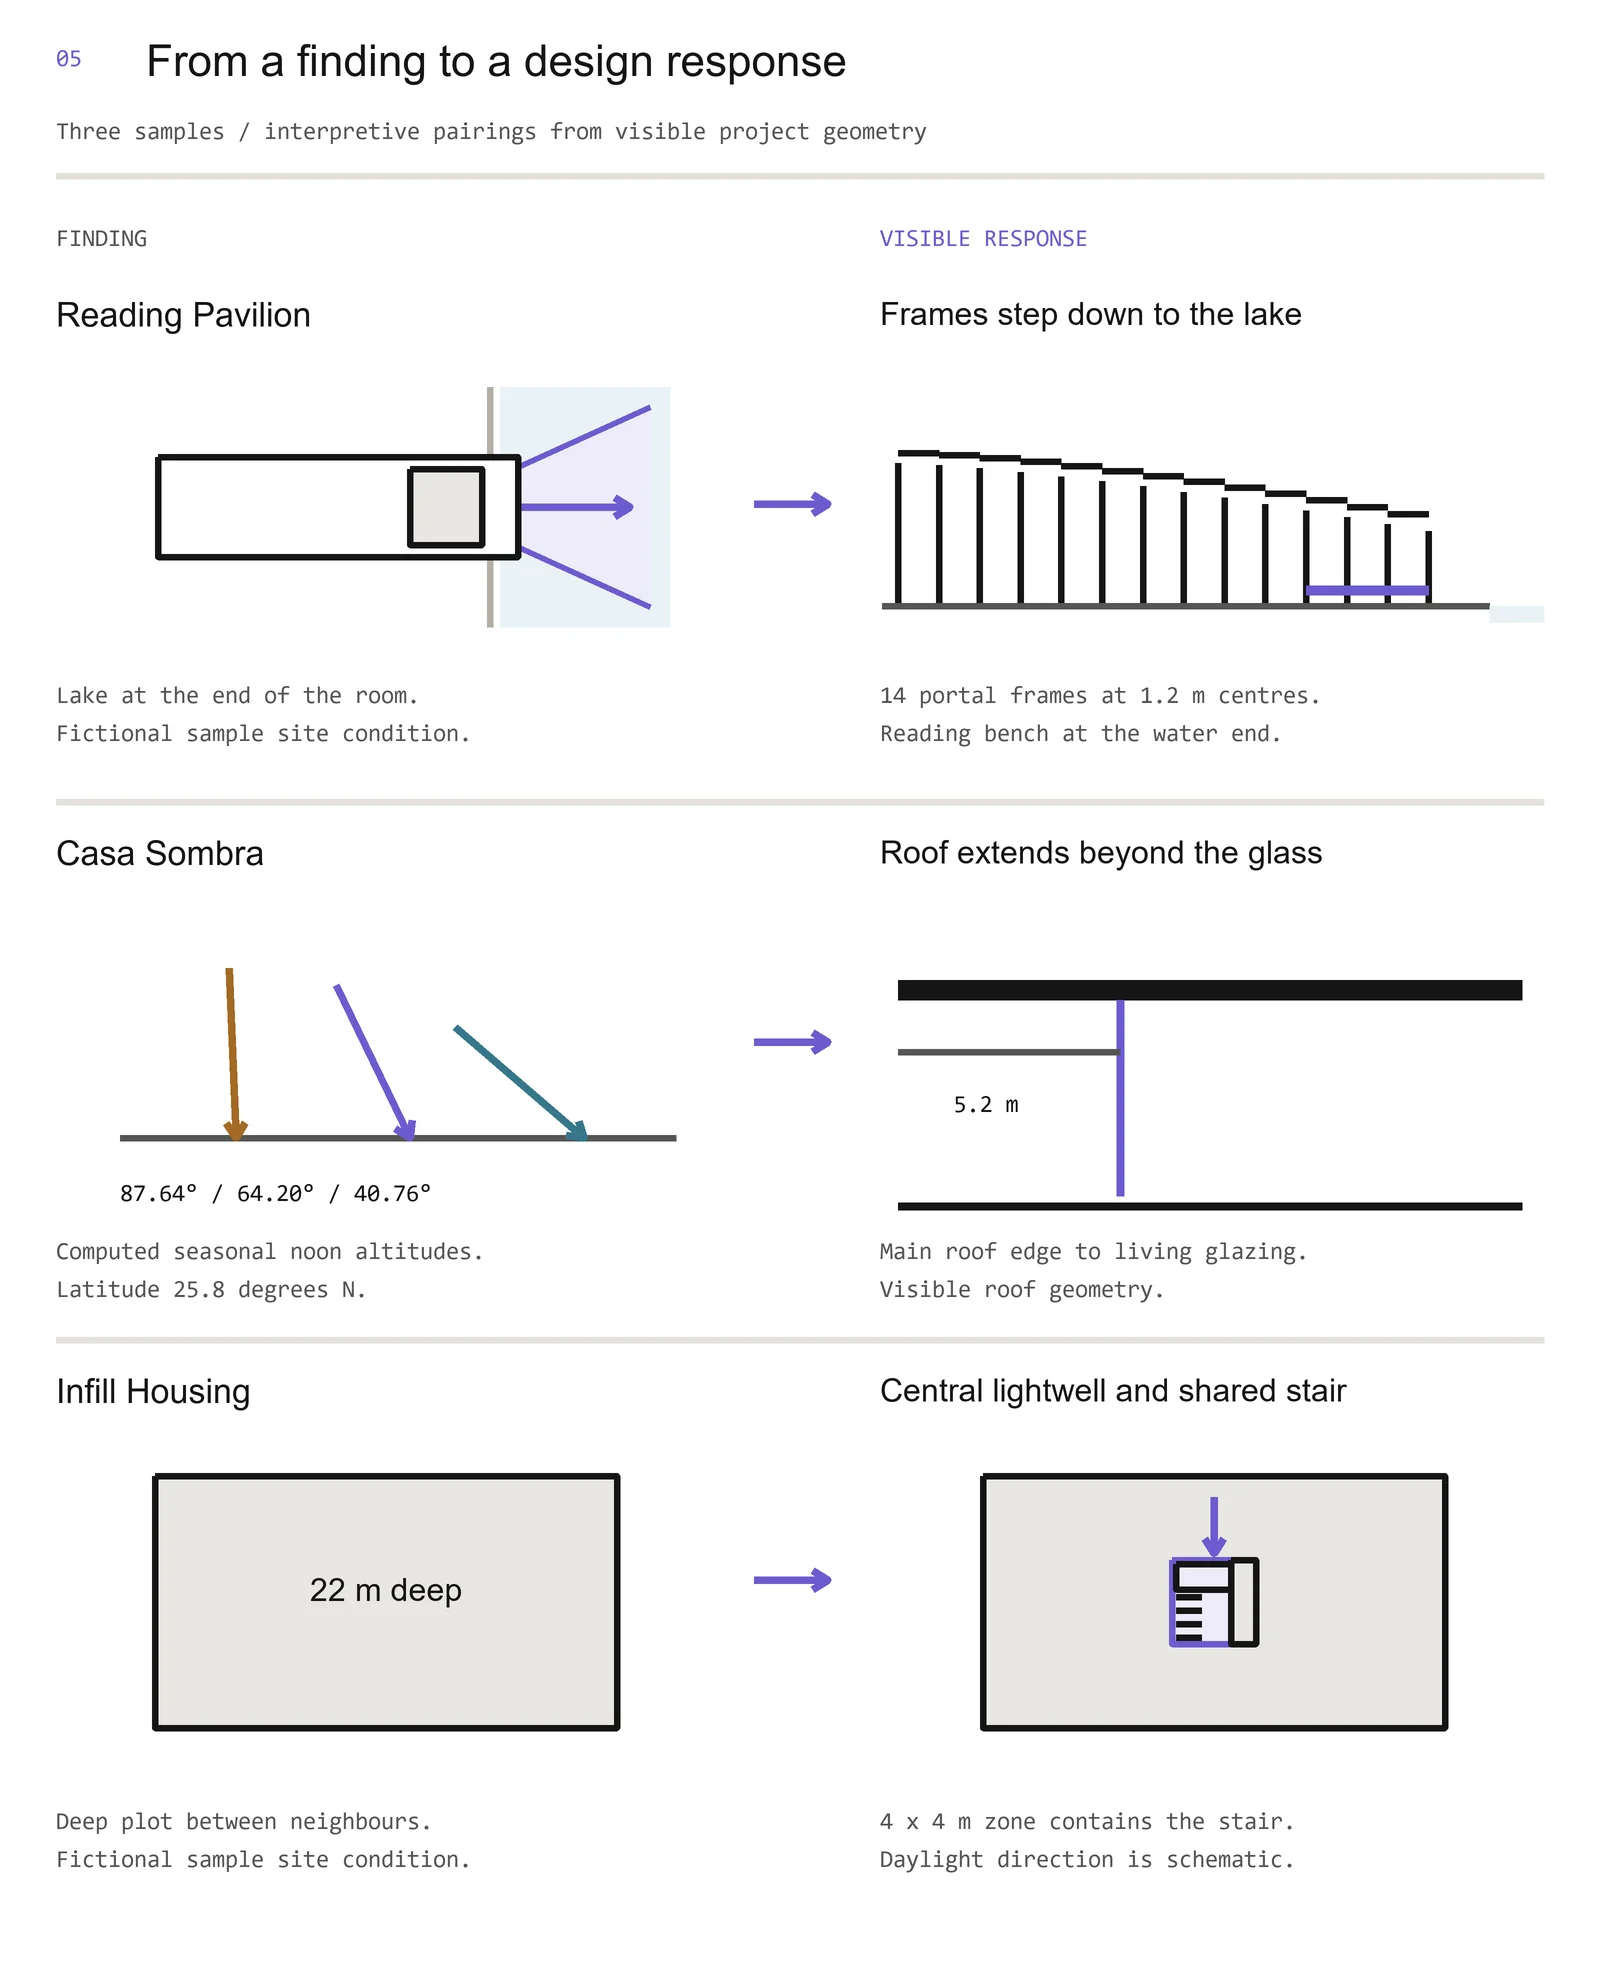
At the Reading Pavilion, the lake lies beyond the bench end. The response is a row of fourteen frames stepping down toward the water, with the bench at the lake end.
At Casa Sombra, the finding is the high noon sun. The response is a roof that reaches 5.2 m past the living room glass on the south side, which you can compare with the sun angles in the section.
At Infill Housing, the finding is a deep plot hemmed in by neighbours. The response is a central lightwell zone, 4 by 4 m, holding the shared stair, landing and gallery.
Apply the same test to your project: every condition you map should either shape a decision or come off the board. Keep unresolved research in your notes. When the responses add up to an organising idea, a parti diagram can explain the arrangement you chose.
Notation that reads
Use consistent symbols and one accent colour per kind of information. Repeat the same line type whenever a condition recurs, give every symbol a legend entry, and make sure labels and patterns carry the meaning as well as colour.
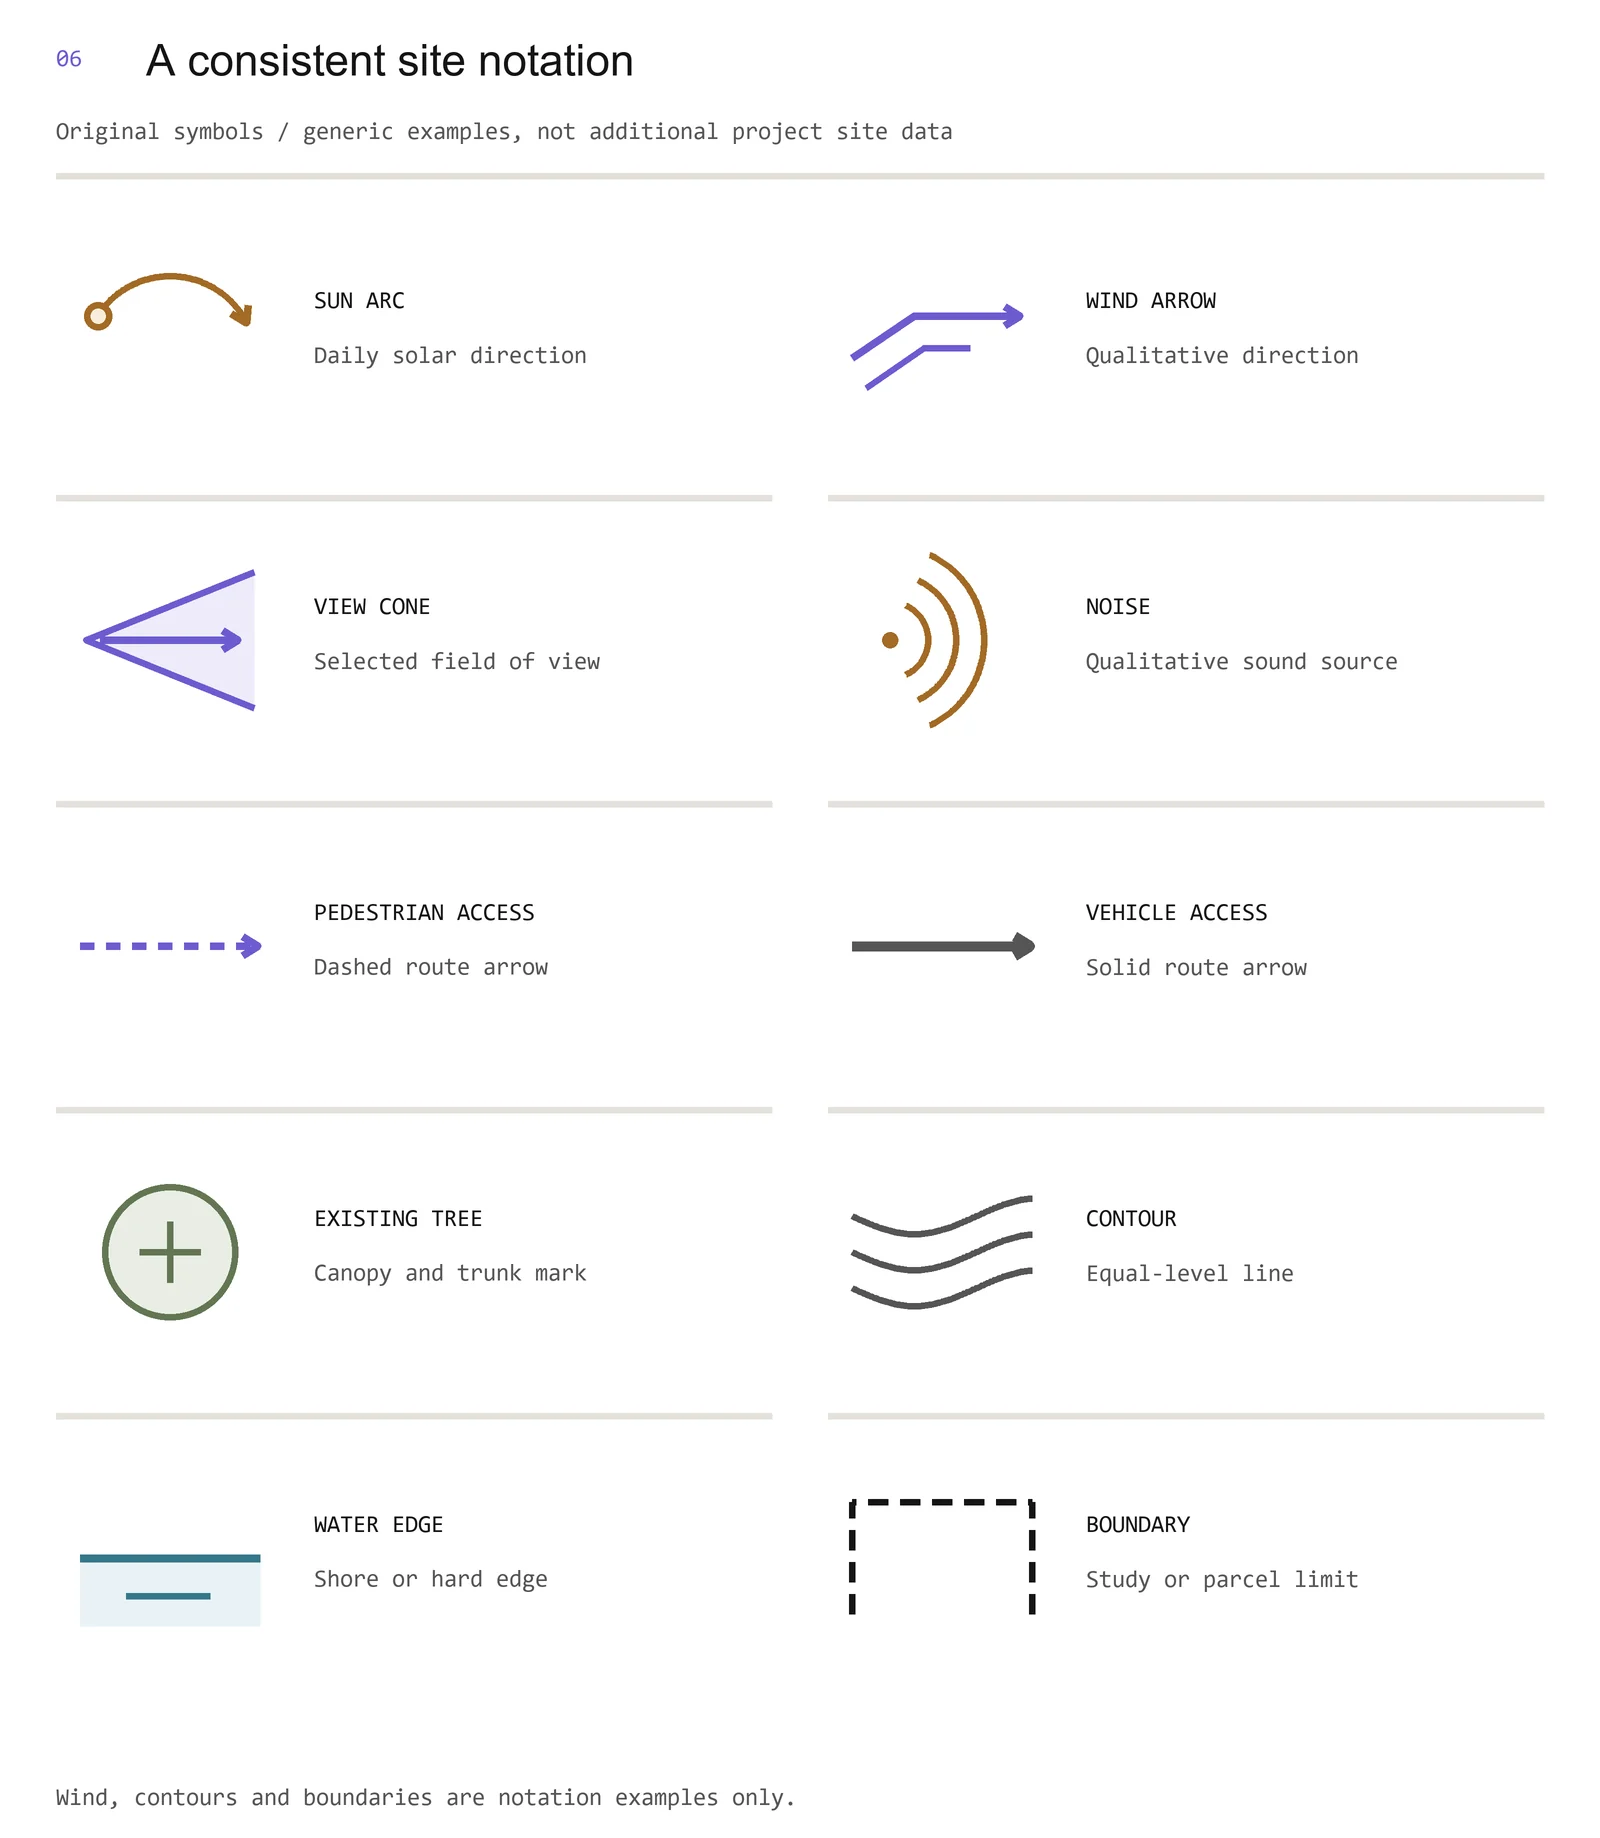
This sheet shows generic notation, including symbols for wind, contours and boundaries; use only the ones your own evidence supports. Anchor each view cone to a viewing position and each route arrow to a route you can name. The floor plan symbols cover the plans your site diagrams sit beside. Check the board at its final printed size, so labels, fills and dashed lines still read.
Landscape architecture site analysis
Landscape architecture site analysis uses the same layered method, with more weight on landform, water, soils and planting. Use surveyed data where it exists and label anything approximate. Keep existing levels and vegetation separate from proposed grading and planting, so it is clear what your design changes.
Common mistakes
- Mapping everything and concluding nothing. Edit the board down to the conditions that shape the project, and write what follows from each.
- Arrows with no source. Say whether a direction comes from an observation, a calculation or an assumption.
- Mixing facts and design ideas. Put the existing condition and your response in separate diagrams, or label them clearly.
- No north arrow or scale. Put both on the base drawing and keep them with it when you resize.
- Generic climate data. Check its location, source and period before applying it to your site.
The Skiaform Portfolio architecture portfolio template for InDesign has drawing pages that suit a site plan with a column of diagrams. The free portfolio checklist helps while you assemble the pages.
FAQ
What is a site analysis in architecture?
It records the conditions a design responds to, such as surroundings, access, sun and views, drawn clearly enough to connect each finding with a decision in the project.
What should a site analysis include?
Context, access, sun and shade, wind and climate, views, noise, water and landform, vegetation and the rules that apply. Research each for your own site, then put the findings that affect your design on the board.
How do you draw a site analysis diagram?
Start with a base plan and draw one condition on each copy, keeping scale and orientation the same. Label sources and assumptions, then combine layers that stay readable together, with one legend.
How do I find the sun path for my site?
Use a sun path tool set to your site's latitude and the dates you want to study. Check its orientation and time settings, and take surrounding buildings and trees into account when you study shade on your design.
How many site analysis diagrams do I need?
Enough to explain the conditions that shape your decisions. Give a condition its own diagram when combining it with others makes the drawing hard to read.
Get the free portfolio checklist
A two-page checklist of the portfolio basics, from choosing projects to sending the PDF. It downloads as soon as you sign up. No spam.